Routes
ViaViz
Replay routing solutions and inspect how agents move, wait, serve requests, and interact over time.
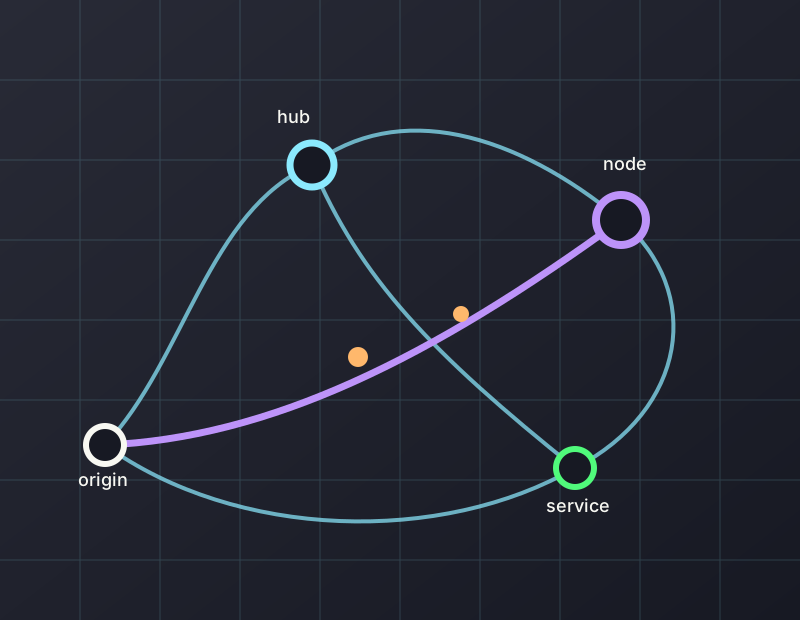
Inspect routing behavior in space and time.
Aggregate indicators describe system performance. ViaViz adds a direct view of routes, stop sequences, loads, time windows, waiting, delays, rejected requests, and dispatch behavior.
Inspect
Replay routes and observe how agents move and interact over time.
Validate
Check whether solver outputs and learned policies behave as intended.
Teach
Help students connect algorithmic output with operational behavior.
Communicate
Make routing experiments easier to explain to technical and non-technical audiences.
Research and teaching origin
ViaViz grew from visualization tools used in mobility-on-demand research. Visual replay helped identify concentration, cycling, and rebalancing patterns that aggregate indicators did not explain directly.
The Transportation and Logistics Management course later used the same approach. Students tested routing algorithms and checked whether the generated routes behaved as expected.
ViaViz supports debugging, validation, teaching, and communication of routing algorithms.
ViaViz is the available edge workbench within LogisticsLab. It remains an independent application at viaviz.logisticslab.io.